

I. Introduction
1. Background and Aims of the Study
Japan has faced difficult situations consecutively, such as the collapse of the bubble economy that peaked in 1990, the Great Hanshin-Awaji Earthquake in 1995, the Asian financial crisis in 1997, the bankruptcy of Lehman Brothers in 2008, and the Great East Japan Earthquake in 2011. Although business in Japan indicated a slight improvement in the early 2000s, the “hard life feeling” in Japanese society still persisted.
The domestic economic gap has been widening. Despite the economic depression in Japan as a whole, the economy in the Tokai district has been considered to lead the business in Japan. This is because manufacturing industries, such as the automobile industry led by Toyota, are experiencing growth there. Although the Tokai district is considered to have a good economy and the people who reside there are considered to be rich, the influence of the Lehman Brothers bankruptcy in 2008 was severe. In addition, the “Toyota shock” struck there, and housing poverty has permeated the calm of the Nagoya Metropolitan Area.
In general, developing the capability to spend housing expenses leads to well-being. So it is to take the policy to stimulate the economy and to enable people to get a house in Japan. Although some people suffer from a housing difficulty in the Nagoya Metropolitan Area, there should be some reasons of housing poverty except for poverty. The aim of this study is to clarify what the cause of housing difficulty is.
First, this study examines the background that has produced “new habitation poverty.” Second, it examines changes in residential qualifications in the Chukyo Metropolitan Area (almost the same as those in the Nagoya Metropolitan Area) and transitions in housing levels based on features of the housing situation in the Chukyo Metropolitan Area. Third, it examines the situation of laid-off non-regular workers in the region where the manufacturing industry is prospering in the Nagoya Metropolitan Area. Finally, it examines housing poverty in the Nagoya Metropolitan Area through the landlord housing helpline. It is gratifying to examine “new housing poverty” in the Nagoya Metropolitan Area and in Japan.
II. New Housing Poverty
In this section, it is confirmed that the difference between “new housing poverty” (people who are unable to live in a dwelling despite vacant houses and the number of dwellings exceeds the number of households) and old housing poverty (where the number of housing units was less than the number of households, and it was not possible to find appropriate habitation exists).
1. Change in housing poverty
Housing poverty in Japan until the end of rapid economic growth meant poverty that occurred throughout the society. After World War II, the number of dwellings was approximately 4,200,000-which was less than the number of households. A decline in production capacity in Japan led to narrowly overcrowded dwellings and an insanitary state caused by the resulting shortage of dwellings. Dissolution of housing poverty was a social problem as well as an individual problem because of the need to prevent infectious diseases.
The large-scale demographic shift from provinces to metropolises occurred during the rapid economic growth of the 1960s and caused serious housing shortage for new households that moved into metropolitan areas. Suburban estates were built in the mid-1970s, and the number of dwellings and households became balanced. Focus of housing issues shifted from housing shortage to dwelling performance, including factors such as dwelling size and living equipment (e.g., electric equipment, air conditioner, sanitary installations, and lift). Dwelling performance became a focal housing issue, and dwelling level was set up as a policy objective for attaining conditions such as those of the rich living in 1973.
Rapid economic growth raised the housing level, and housing poverty was no longer recognized in Japan. Rising land prices, increasing wages, and lifetime employment raised the housing levels of workers and households. The path toward improvement in housing levels that began with wooden rental apartments in early-term household formation to the acquisition of detached housing with gardens in the suburbs was called the “housing ladder.” Public housing was positioned as a special case of those who were unable to ride on the housing ladder and get dwellings in the housing market, the base point that operates as the beginning of the ladder.
2. Residential housing acquisition and improvements in housing standards in Japan
Rapid economic growth in Japan fundamentally ended by the oil crisis in 1973, and economic growth in Japan became unstable.
Residential housing acquisitions and improvements in housing standards in Japan occurred through economic growth. In addition, the Japanese economy had features such as senioritybased wage system and lifetime employment as well as spiralling land prices. The central government supported the establishment of desirable dwelling using housing finance through the Government Housing Loan Corporation of Japan. When people could not acquire a dwelling in or were driven off the housing market, the non-market society comprising families, relatives, and communities helped them. Changes of household size showed it. Although the average household size during times of rapid economic growth was approximately 4.5 persons, it is less than 2.5 persons at present. One- and two-person households constitute the majority of households. During that time, if one household could not reside in a dwelling, two or more households would combine to reside in the dwelling. Although this overcrowded many dwellings, it resulted in cooperation that fulfilled a valuable social function. Even when someone could not work because of illness or injury, they could live on someone else’s income. When the breadwinner in a one- or two-person household cannot work because of injury or illness, they do not have such a safety net. Cooperation among families, relatives, and communities gradually declined due to demographic shifts and reductions in the household size. Reductions in the household size or the number of persons living in a dwelling were affected by industrial conversions and changes in the form of business enterprises.
The demographic shift from rural to metropolitan areas decreased the number of multigenerational households and increased the number of nuclear families. Nuclear families moved into new residential estates in metropolitan suburbs and left elderly persons in the inner areas, and this movement advanced the change to smaller household sizes. Changes in residential status and small household sizes have caused the present vulnerable habitation situation.
In Japan, family and relatives, community, and company support the living. Governmental social security supports people without a living support. Government finances are pressed by annual expenditures on social security such as medical treatment and welfare for the progressively aging population and public works such as business-stimulating measures, and it is impossible to fully expect a governmental social security system. Currently, function of the company, relative, family, community, and government to support living conditions has stopped.
3. The appearance of new housing poverty
Dwelling as a result of working was no longer functioning, and the concept of new housing poverty emerged. Since the 1990s, capital and labor have moved easily beyond borders. Companies reduced personnel expenses by increasing the proportion of youth non-regular employees and discharging middle-aged employees for international competition.
Companies abandoned the opportunity to educate and train regular employees because of changes in production technology and the legal system that introduced generalized worker dispatching. Subdivision of processes, the weight savings of manufacturing equipment, and increased manufacturing ease resulted in labor being subdivided into simpler work. More workers now could work on production lines without learning any special skills. Subdivision and simplification of labor gave low-wage workers opportunity to work.
Consequently, character of workers gravitated toward cheaper labor, moving from predominantly sturdy adult-aged men to the elderly, women, and foreigners. Many foreign workers lived in dormitories and company housing in the suburbs near factories to become engaged in the manufacturing industry.
On the other hand, work in the city comprises miscellaneous businesses, such as packing, sorting products, delivering, security, and cleaning, and this is spreading in city areas as dispatch work. Workplaces of city miscellaneous business move depending on the demand for these services. Temporary workers must secure and pay the expense of transportation to the place of work. In this manner, the number of unstable and low-income workers has increased in both cities and the suburbs.
Contemporary society cannot distribute dwellings to those who cannot pay rent or make housing loan payments and those who have no connection to organizational or personal support when they encounter financial trouble. Although there is a 13.5% housing vacancy (2013 Housing and Land Survey), many people are still unable to afford a dwelling. This phenomenon is the new housing poverty occurring 70 years after the World War II. The function of distributing society’s excess housing stock to the poor has declined.
III. Housing Situation in the Nagoya Metropolitan Area
1. Housing levels of the Nagoya Metropolitan Area
This section surveys the housing situation of the Nagoya Metropolitan Area using the Housing and Land Survey.
According to the Minimum Housing Area Standard as defined by the Ministry of Land, Infrastructure, Transport and Tourism, the ratio of population that is above the minimum housing area standard is 90.9% for the Chukyo Metropolitan Area (2013), better than those in the Kanto (86.3%) and Kinki (88.9%) Metropolitan Areas.
The index of others in the Housing and Land Survey (2013) is as follows. The number of housing units in the Chukyo Metropolitan Area is 6.9% of all units in the country, which is less than one-fourth of that of the Kanto Metropolitan Area (30.3%) and is half of that of the Kinki Metropolitan Area (15.9%). Although the housing vacancy rate of the Chukyo Metropolitan Area is 12.6% and is higher than that of the Kanto Metropolitan Area (11.4%), it is lower than that of the Kinki Metropolitan Area (13.9%). The ratio of housing ownership in the Chukyo Metropolitan Area is 61.3%, which is higher than those in the Kanto (56.5%) and Kinki (59.5%) Metropolitan Areas. The average number of dwelling rooms per dwelling in the Chukyo Metropolitan Area is 4.82, which is higher than those for the Kanto (3.91 rooms) and Kinki (4.41 rooms) Metropolitan Areas. The average size of a dwelling unit in the Chukyo Metropolitan Area is 98.14 square meters, which is larger than those of the Kanto (77.36 square meters) and Kinki (85.40 square meters) Metropolitan Areas. The average number of tatami units of dwelling rooms per person in the Chukyo Metropolitan Area is 14.05 units, which is larger than those of the Kanto (12.41 units) and Kinki (13.22 units) Metropolitan Areas. The average number of persons per room in the Chukyo Metropolitan Area is 0.52 person, which is the same as that for the Osaka Metropolitan Area (0.52 person) and smaller than that of the Kanto Metropolitan Area (0.58 person). The average rent per tatami unit of rental housing except company’s houses in the Chukyo Metropolitan Area is cheaper than the national average, which is the cheapest when compared with the three major metropolitan areas. The average rent (1788 Yen) of company’s houses in the Chukyo Metropolitan Area is higher than the national average (1542 Yen) and the in the Kinki Metropolitan Area (1704 Yen). In other words, the housing situation in the Chukyo Metropolitan Area is at the best level of the three major metropolitan areas in Japan. Lately, housing construction in Aichi Prefecture has been prosperous, which is indicated by a conspicuous increase in the number of dwellings.
One index that features Aichi Prefecture indicates a significant population size with Brazilian nationality. According to the Foreign Resident Statistics in December 2012, Tokyo Metropolis tops the list with 393,585 foreigners, followed by Osaka Prefecture with 203,288, and Aichi Prefecture with 195,970. Among these Brazilians, 50,529 reside in Aichi Prefecture, the most in Japan, indicating that those in Aichi Prefecture constitute one-fourth of Japan’s total Brazilian population (190,581). There are 105,051 Brazilians living in the four Tokai prefectures, 29,668 in Shizuoka Prefecture, 13,324 in Mie Prefecture, and 11,530 in Gifu Prefecture, constituting the national majority (55.1%).
Although homelessness is considered to be the severest form of housing poverty, the number of homeless people in Aichi decreased from 2,121 in January 2003 to 380 in January 2014. Although Aichi Prefecture follows Osaka (1,864 persons), Tokyo (1,768 persons), and Kanagawa Prefecture (1,324 persons) in terms of the number of the homeless, it is in a different the order of magnitude from the top three prefectures. The number of rough sleepers in Nagoya decreased from 1,788 in January 2003 to 264 persons in January 2014. The ratio of rough sleeping sites is indicated as 38.4% in river banks, 29.7% in city parks, 24.2% in others, and 9.7% in streets. The average age of rough sleepers increases each year and shows the difficulty of escaping from rough sleeping.
2. Changes in residential qualifications
This section examines accommodations for the low-income due to changes in residential qualifications in Aichi Prefecture from the viewpoint of housing poverty.
The total number of households in Aichi Prefecture increased by 127.1% between 1998 and 2013, that of rental households by 127.5%, and that of households with annual income less than 3 million Yen by 138.4%. Although the number of households with an annual income less than 3 million Yen increased in Aichi Prefecture, the percentage showed no fluctuation. The average rent of a rental house increased from 46,332 to 51,634 Yen (increased by 111.4%). In terms of the change in the consumer price index, the low-income group’s habitation situation has worsened.
Table 1.
Low-Income Households in Rented Housing in Aichi Prefecture
The number of public residences that the low-income group is provided with showed no fluctuation and remained at 199,344 (99.2% of the 2007 level) in the 2012 fiscal year, which was 200,936 dwellings in the 2007 fiscal year. It indicates a slight decrease in the UR Agency housing and a slight increase in municipal housing. Considering the increase in the number of total households and rental households in Aichi Prefecture, the public housing percentage for the lowincome group has been decreasing.
The situation of privately-rented houses is shown in <Table 3>. The number of such houses increased from 635,600 in 1998 to 892,500 (140.4% increase) in 2013. The housing allowance in Nagoya is 35,800 Yen, but the number of housing units with monthly rental amounts below 40,000 Yen decreased from 167,300 in 1998 to 154,700 (92.4% of 1998 level) in 2013. The ratio of rental houses with a monthly rent of less than 40,000 Yen in privately-rented houses decreased from 26.3% to 17.3%. This shows that the number of affordable dwellings where low-income households can live is decreasing.
Table 2.
Public Dwelling in Aichi Prefecture
Table 3.
Monthly Rent of Privately-rented Houses in Aichi Prefecture (Thousand Yen)
People who occupied buildings other than dwellings fall into the category of new housing poverty, and their total number decreased to 91% of the prior level between 1998 and 2013, as shown in <Table 4>. The number of people residing in workers’ dormitories decreased to 50.5% of the prior level (the reduction number is 46,700 persons). In contrast, the number of people who reside in “other buildings” increased from 37,500 in 1998 to 69,600 (185.6% of prior level) in 2013. Although companies have difficulty owning dormitories for employees, it is necessary to have places where temporary or contract workers can live. Other buildings means social institutions, hospitals, factories, workplaces, offices, and so on. It is guessed that the increase in other building habitation depends on staying at free or low-cost institutions that do not have law, factories, workplaces, and offices rather than the dormitories of companies.
Table 4.
Household Members in Occupied Buildings other than Dwellings in Aichi Prefecture
In Aichi Prefecture, the number of households in rented housing has been increasing, and monthly rent has been increasing. It is possible to infer that the number of lowincome households who need social support is increasing. The number of social houses has been stable, and the number of low-rent private houses and workers’ dormitories has decreased. It is possible to infer that the miserable dwelling situation for some workers is a result of the increase in persons occupying “other buildings”.
3. Changes in housing levels
The ratio of population who live below the minimum housing area standard in the Chukyo Metropolitan Area and the whole country was 3.8% and 5.1% in 1998, 3.3% and 4.2% in 2003, 6.0% and 6.7% in 2008, and 6.6% and 6.9% in 2013, respectively. The ratio in the Chukyo Metropolitan Area is lower than the national level in all years, and the housing level in the Chukyo Metropolitan Area is higher than the national average. The ratios the whole country and the Chukyo Metropolitan Area declined between 1998 and 2003 and increased between 2008 and 2013. The 2013 ratio compared with the 2008 level, was 103% for the whole country and 110% for the Chukyo Metropolitan Area.
As shown in <Table 5>, the higher the household annual income, the lower the ratio of living below the minimum housing standard in Aichi Prefecture. The ratio declined in all the annual household income classes between 1998 and 2003. The deterioration of housing standard for low-income households has occurred in recent years.
Table 5.
Percentages of Population below Minimum Housing Area Standard by Household Income in Aichi Prefecture
| Household income (million Yen) | 1998 | 2003 | 2008 | 2013 |
|---|---|---|---|---|
| Under 2 or less | 6.7 | 5.6 | 8.7 | 10.8 |
| 2-3 | 5.9 | 5.1 | 7.1 | 7.0 |
| 3-4 | 5.3 | 4.5 | 6.5 | 7.3 |
| 4-5 | 5.7 | 3.9 | 5.7 | 6.7 |
| 5-7 | 4.4 | 3.3 | 4.0 | 4.9 |
| 7-10 | 2.7 | 2.0 | 2.3 | 2.7 |
| Over 10 or more | 1.3 | 1.0 | 0.9 | 1.2 |
The number of households that live below the minimum housing area standard increased notably for households with an annual income of less than 7 million Yen between 1998 and 2013. For households with an annual income of 10 million Yen or more, the number of those that live below the minimum housing area standard decreased notably, as shown in <Table 6>.
Table 6.
Number of Households below the Minimum Housing Area Standard by Household Income in Aichi Prefecture
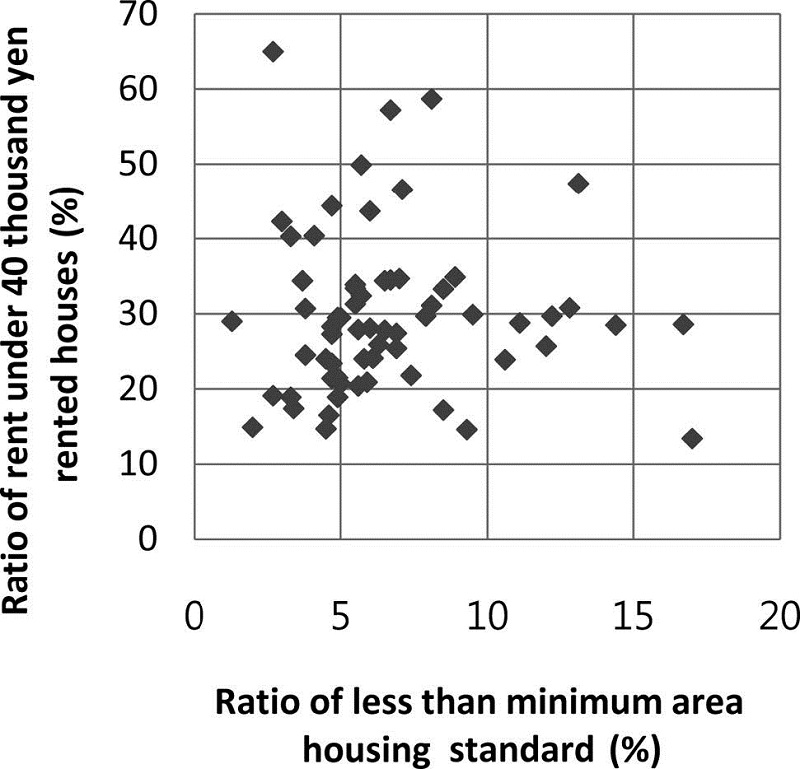
To examine the difficulty of the low-income group’s habitation, a graph for Aichi prefecture was made with the horizontal axis as the ratio of those who live below the minimum housing area standard and the vertical axis as the ratio privately-rented houses with a rent below 40,000 Yen in 2013.
In 2008, the plot of each municipality was distributed, focusing on approximately 25% of rents under 40,000 Yen for privately-rented housing and approximately 6% of the ratio of those below the minimum housing area standard. It is observed that unique municipalities distant from the average are at the lower right and upper left of the graph.
The group at the lower right of the graph indicates a high ratio of cases below the minimum housing area standard and a low ratio of rents less than 40,000 Yen for privately-rented housing and thus low income earners cannot live easily there. These areas are at the centre of Nagoya and its circumference divisions are Nakamura-ku (17.2, 31.2%), Naka-ku (16.8, 12.8%), Chikusa-ku (14.5, 22.4%), Nishi-ku (13.9, 22.4%), Higashi-ku (12.3, 18.2%), and Showa-ku (11.7, 18.1%). On the other hand, the group at the upper left of the graph indicates a low ratio of cases below the minimum housing area standard ratio and a high ratio of rents less than 40,000 Yen for privately-rented housing and thus low income earners can live there easily. These areas are Minamichita-cho (2.8, 81.5%), Mihama-cho (5.1, 71.3%), and Isshiki-cho (1.5, 70.5%), located at the tip of the Chita peninsula on the opposite shore.
In 2013, Minamichita-cho (2.7, 65.0%) sits at the top left and Naka-ku (17.0, 13.4%) as shown in <Figure 1>.
The number of households that live below the minimum housing area standard increased with annual household income less than 4 million Yen between 1998 and 2013. This shows that dwelling levels did not improve. Low-income households in the central part of the Chukyo Metropolitan Area were found to be living in miserable condition.
4. Non-regular workers’ discharges and dwellings
The manufacturing industry is the major feature of the Nagoya Metropolitan Area. This section discusses dispatched temporary workers’ housing poverty.
The words “the discharge of the dispatched temporary workers” hit the headlines in mass media after the bankruptcy of Lehman Brothers in 2008. Many employees suddenly lost their dwellings and workplaces without good reasons. The Ministry of Health, labor and Welfare reported the situations of the discharge of the dispatched temporary workers periodically, and according to the report in October 1, 2010, 292,375 dispatched workers lost their jobs in Japan between October 2008 and December 2010. The top five places in terms of number of job losses are shown in <Table 7>. When Tokyo and Kanagawa Prefecture are removed, the remaining areas are prefectures in the Tokai area only. Mie prefecture gains the sixth position (9,502 persons), and Gifu prefecture gains the ninth position (7,851 persons). Many non-regular workers lost their jobs in the Tokai area.
Table 7.
Number of Housing Losses by Situation of Discharged and Dispatched Temporary Workers (Top 5)
The situations of the discharge of the dispatched temporary workers shows a housing loss situation. This number is a result of making approximately 64% of persons applicable to investigation. Of the non-regular workers, 2% lost their dwellings and jobs nationally. The ratio of housing loss differs according to the working form: 4.1% for contract workers, 2.6% for dispatched workers, 1.9% for temporary workers, and 0.1% for others.
The number of those who lost their homes was estimated from the total of the discharge of the dispatched temporary workers and differs from the number who lost housing as estimated according to employment form. Difference in the percentage of the employment form in the area has influenced the estimation value. In Aichi Prefecture, the number of people who lost their homes (973 persons) estimated by employment form exceeds the number estimated from the total number (940 persons). In Tokyo, the number of those who became homeless (183 persons) estimated by employment form is less than that estimated from the total number (376 persons).
The reason for the big difference in estimation value in Tokyo is that there are many other employment forms. The employment form of the area, which reflects the industrial structure, has produced the difference in the number of people who lost their home. There are many non-regular workers employed at large-scale factories in the suburbs of Aichi Prefecture and the Tokai area, with much of the auto industry and the manufacturing industry centred on Toyota Motor Corporation. Many factories stopped or reduced operation in the deep slump that followed the bankruptcy of Lehman Brothers, and employed non-regular workers lost work and addresses.
In the case of women, there are many flatmates, and although there is less possibility of losing a dwelling, men and foreign workers have higher possibilities of losing both dwellings and place to work. Although the lives of non-regular workers who lost homes is unknown, according to mass media reports, many foreign households are being forced into overcrowded dwellings so that there may also be few people who can depend on and help each other. For Japanese, there are cases where they live in the free or low-fee lodgings or institutions that are not stipulated by law that are unsuitable for persons.
IV. Housing Poverty Issue Examined through Housing Helpline by Volunteer Landlords
This section examines the housing helpline by volunteer landlords, Aichi apartment house association, to clarify housing difficulties that cannot be supposed from existing statistics. Analytic objects are consultations in the 2013 fiscal year (between April 1, 2013 and March 31, 2014). Various people used the helpline, such as a resident, a future resident, people who are involved with a resident, a person with a possibility of becoming homeless, an administration person in charge, a supporting organization, a lawyer, a landlord, and a real estate agent. This section analyses 188 inquiries connected with housing difficulty. Inquiries were classified into the following 10 types based on the cause of consultation and the situation before and after consultation.
(1) Move after livelihood protection receipt (14 cases)
In the present welfare system, livelihood protection receipt does not promise the stability of housing life. Those who reside in a dwelling with a rent that exceeds the amount of their housing allowance are guided to move. Because livelihood protection is the minimum amount of money that can maintain living, they cannot live when they spend livelihood protection for housing expenses. Reduction in household size because of a spouse’s death and working difficulties caused by childbirth, rheumatism, and cerebral infarction are the reasons for rent to exceed the amount of housing allowance.
(2) Rent in arrears, a loan breakdown (40 cases)
There are many consultations involved in this case. The direct cause for economic problem is poverty caused by unemployment. The reasons for unemployment are injury, illness, traffic accident, and bankruptcy, and the reasons for difficulty in paying rent are movement of the flatmate who had paid the house rent, dispatch working, and addiction to gambling.
(3) Demolition of dwelling (14 cases)
Although most dwellings pulled down are superannuation, most residents are aged. The superannuated building must conduct rebuilding and reinforcement to maintain quakeproof strength. The resident has retired or lives on few pensions, and it is difficult to find new home because they are low-income workers or the jobless. Furthermore, there is the necessity for going to hospital regularly with illnesses resulting from aging, or there is a failure of cognitive function, and it is hard to consult or judge.
(4) Divorce and leaving for discord (22 cases)
The cause of discord with a flatmate varies. Problems related to care, such as disability, illness, and dementia, are related to the cause of discord in many cases. When the size, equipment, and location of the dwelling that is a base of living or care were appropriate, it might prevent collapse of the living situation.
(5) There is no right to live (6 cases)
There are also those who have not secured the right of legal habitation. A husband who has not been divorced legally leaves and the wife cannot continue to live. Since a parent parent who is the nominee of a dwelling entered the institution, the child was made to leave. A husband who is a nominee of a dwelling passed away, and the wife was made to leave. Her cognitive ability is declining. The land lease reached an end. A lease nominee’s husband and wife left and the resident who is not contained in the rental contract cannot continue residing.
(6) Domestic Violence (10 cases)
A new address must not be known by flatmates, such as a spouse, not to worsen domestic violence (DV) damage. Therefore, examination of movement may not be realized. Surveying cannot be performed by consultation, information gathering by telephone, mail delivery, or fax of the time zone when the flatmate is at home. The consultation should be done except the other time zone or a house. Moreover, there are also many female victims who have a child, and they need to look for a new address, considering the child’s access to school. If the DV victim is a person with disability, to look for a barrierfree house, the difficulty of housing selection will amplify. There are some victims who do not use DV for an image or living environment, but they would like to live in an ordinary dwelling.
(7) Leaving from a dormitory, a company’s house for employees (16 cases)
Habitation in a company’s house for employees or a dormitory needs the person to be employed in a company. Habitation is not secured if it becomes impossible to work for some reasons. The reasons for the inability of people to work are the retirement age, termination of employment, dismissal, illness, pregnancy, a queer voice and a psychiatric disorder. There is also a problem infringing the habitation rule, such as pet breeding. Moreover, there is also the case in which they cannot reside in a dormitory because of the trouble caused by their relatives.
(8) Leaving hospital and institution (18 cases)
There is no dwelling to live after leaving hospital. If a long term of stay is expected at the time of entrance to a hospital or an institution, a one person household might cancel the contract of rental housing to save money. As a result, the place of living is lost at the time of leaving hospital or institution. Furthermore, people who do not have a place of living may be involved in criminal offences to fulfill their needs. Although many residents of the free or low-fee lodging used be rough sleepers, there is no dwelling to live after leaving a free or low-fee lodging.
(9) There is no house, rough sleeping (12 cases)
Petition from the rough sleepers, “there is no house” is serious. There are people without a secured house, the rough sleeper of pensioner, those who receive livelihood protection are staying at net cafe with trouble, the dwelling where the disabled person resided was sold, those who are rough sleepers who have lost dispatched jobs, those who are sick and lost their job and are staying in the car, the rough sleepers who ran away from their house, and those who have emigrated to the Nagoya Metropolitan Area from rural areas.
(10) Look for a new address (20 cases)
Many aim to evade the difficulty of the present living, but the concern arises regarding a habitation for future.
However, the most common reasons for housing difficulty are economic problems, triggered by bankruptcy of the company, layoffs, illness, and injuries.
V. Conclusions
Considering the new housing poverty in the Nagoya Metropolitan Area, this study enumerates the following concluding points.
(1) Stagnating land price, falling wage, unstable employment, and reduction of household size stopped the mechanism of acquisition of a dwelling and improvement of housing standards.
(2) Factors such as stagnation of public housing decrease of a low-rent homes and increase in a free or low-fee lodging or the living accommodations that do not have a law promote the new housing poverty.
(3) The percentage of those living below the minimum housing standard area is increasing among low-income households and is decreasing among higher income households.
(4) Low-income households live easily in some communities, whereas they find it difficult to live in some other communities.
(5) The number of people residing in buildings other than a dwelling is increasing.
(6) According to the example of a helpline, everyone loses a dwelling easily, and it is difficult to secure a stable dwelling again.
Reasons why those with low income suffer when looking for dwellings include reduction of public housing and low-rent private sector rental housing, decline in income, and guarantor’s absence. However, various reasons exist for the difficulty in securing a stable dwelling. Policies implementing the necessary changes to improve the standards of housing and aiming to reduce housing poverty are essential. There is the problem of asymmetric information of residential house acquisition; moreover, the information spread of the social resources that resolve the difficulties involved in housing is not progressing. A policy that guarantees and recognizes the housing right is demanded.
