

I. Introduction
1. Background & purpose
Many countries in the world are going through a demographic shift with low birth rates and an increase in older populations. In the U.S., as Baby Boomers age, the elderly population will grow. The Administration on Aging in the U.S. Department of Health and Human Services projected that the percentage of the population 60 and older will increase from 16 percent in 2000 to 25 percent by 2030 and 26 percent by 2050 (Administration on Aging, 2017). These demographic shifts will influence the housing market and available housing options.
In terms of housing options, it is important for older adults to be able to maintain independence (Fausset et al., 2011) and familiarity with living environments for successful aging. Aging in Place (AIP) was a term coined to define this desire for the elderly to age in their own homes without having to move elsewhere. A study about AIP desires indicated that 88 percent of participants age 55 and over answered that aging in place is very important, answering 8 or higher on a scale of 1 to 10, with 10 as extremely important (Will, 2015). While the majority of older adults prefer aging in place instead of moving to a new place, the same study demonstrated that only 36 percent of them considered accessible homes with the same level of importance.
Accessible housing means housing that has adaptive features including an easily transferable bath/shower, grab bars, and easy-to-reach shelves in cabinets (Memken & Earley, 2007). As many older home owners do not recognize the accessible home environment as an important feature to maintain, inadequate housing environments for older adults can impede aging in place. Thus, in order to support AIP, the discrepancy between the level of desire for aging in place and the level of the physical readiness of accessibility is a critical aspect to explore. While older home owners perceive the importance of having accessible homes that can accommodate their physical needs, they tend to neglect home improvement needs and choose to live with the current condition of their homes (Merrill, 1989). Unfit physical environments become potential risks that threaten the safety of older adults and may hasten institutionalization (Brent et al., 1991). Therefore, this study aimed to explore perceptions of older adults with regard to the physical environmental conditions of their housing, difficulties in performing activities in daily life, and intention to remodel the home environment for AIP.
II. Literature Review
1. Aging in place and home remodelling
As the older age group grows in number and many of them desire to stay in their own homes for the remainder of their lives, the AIP movement has been considered an important aspect in public policy (Pynoos et al., 2008).
The increase in AIP led to some changes in public funding distribution to older adults. Houser, Fox-Grage, and Ujvari (2012) identified key findings in their long-term services and support study. One of their findings indicated an increase in Medicaid-funded homes and community-based services for older adults with physical disabilities.
There have been known benefits of AIP such as individual cost savings and potential reduction to Medicaid and Medicare (Administration on Aging, 2017). However, barriers to implement AIP still exist and hinder AIP. These barriers include the cost of house maintenance, inaccessible design features in the current U.S. housing stock, and no regulations for accessible features in single family housing (Lehning, 2011). Older adults experience limited physical ability and decreasing functional competence. In addition, they need to deal with physical environments built for younger people (Lawton, 1990). Studies show that many people desire to age in place (AARP, 2003; Will, 2015). However, there is a gap in the fit between the level of desire to age in place and the architectural readiness in housing conditions. Studies show that older adults do not seem to have the same level of desire for accessible housing features such as non-slip floor surfaces, grab bars, a bathing stool, emergency alert system, and an entrance without steps for AIP (AARP, 2003; Will, 2015). Consistent research results based on existing studies show that older adults with functional limitations experience various difficulties moving around in their residences and have problems with physical environments such as home remodelling needs (Gitlin, 2003).
2. Activities of daily living (ADLs) and instrumental activities of daily living (IADLs) and seniors
Independent living and abilities to maintain ADLs are closely related (Mack et al., 1997). Horgas, Wilms, and Baltes (1998) in their study about older adults aged 70-105 in the U.S. showed that most of older adults’ activities were done alone and at home. This implies that residential environment is critical to older adults’ well-being. There are two main types of activities: Activities of Daily Living (ADLs) and Instrumental Activities of Daily Living (IADLs). ADLs include such essential living tasks as toileting, bathing, and eating; IADLs are related to tasks that are cognitively demanding such as house cleaning, cooking, and managing medications (Lawton, 1990). Lawton (1990) suggested that older people with major deficits in mobility would be at very high risk for institutionalization, and this group would be at the top priority for community-based in-home services.
Thus, this group would benefit from such services for AIP. However, while in-home services have grown in use in recent years, services related to physical environment have not been supported due to the complicated nature of services for the physical environment (Lawton, 1990). Clark, Czaja, and Weber (1990) claimed in their study that it would be important to examine ADL/IADL tasks in relation to the environment where the task was performed by older adults in their daily lives. It is necessary to further explore difficulties that older adults experience performing ADL/IADL in the home environment, especially in problematic areas such as the kitchen and bathroom.
3. Senior housing: Kitchen and bathroom
Previous studies demonstrated that the kitchen and bathroom needed more attention for improvements, as inadequate physical environmental features that could cause safety problems to older adults were found mainly in these areas (Brent et al., 1991; Fielo & Warren, 2001). Brent et al. (1991) found that more than half of the older adult housing studied had inadequacies in bathroom such as inadequate grab bars, no seat in the bathing area, and inadequate lighting. In the kitchen, top shelves that were difficult to reach and step-stool usage were identified as inadequate features for more than half of the household that participated in the study. Fielo and Warren (2001) suggested some assessment and intervention items in the home environment in order to examine the existing home environment for older adults. Similar to findings from Brent et al. (1991), Fielo and Warren pointed out that it would be important to be able to access various items in the kitchen. Adjustable height counters and drawers would be useful as well. For the bathroom, they suggested that it would be helpful to have raised seat toilets, grab bars, benches for the bath/shower, a bath lift, and a handheld showerhead as well as a non-slip floor.
III. Method
1. Sample
The population targeted for this study was adults, ages 60 and over. The age constraint was justified by the aims of the study, which were specific to the relationship between older adults’ in-home daily activities, their physical abilities, and the kitchen and bathroom areas in their homes. To ensure that participants’ rights were protected and that no more than minimal risk was posed, the study excluded adults 65 and over that are experiencing any health or cognitive issues potentially affecting their ability to give informed consent. The sample was recruited through investigators’ acquaintances and the Center for Healthy Aging Research (CHAR) Linking Individuals, Families, and Environments (LIFE) registry at a university. There were 31 participants with 9 male and 22 female participants.
2. Procedure
Participants were contacted through email and phone calls and scheduled appointments to complete a survey through an interview. The responses were recorded on the printed survey tool, and the interviews were recorded for future analysis to accurately capture the session data. Each data collection session took about 45~60 minutes. Collected data was transcribed and coded after data collection. Coded data was reduced and categorized.
3. Survey instrument
The data for this study was collected by administering a survey through an interview that was comprised of open-ended questions, multiple-choice questions, and questions answered with Likert-type scales. The first section included questions about demographics; gender (male, female), year of birth, persons living with (none, spouse, children, other), finance sources (self, children, government programs, other), and monthly income (less than $500, $500-1,000, $1,001-2,000, $2,001-5,000, more than $5,000). The second section was about senior-friendly products. It asked participants if they owned senior-friendly products. An example image in color was presented for each product. There were 35 products that were presented.
The third section asked about caregivers; participants had a caregiver, caregiver types, caregiver support type (physical, social, or psychological support), and future caregiver type preference. The fourth section asked about current housing such as years lived, ownership and housing type, and size. The fourth section evaluated general home environment in terms of lighting, floor condition, stairs, kitchen, bathroom, and indoor air quality. The questions that asked about general home environment were assessed through a five-point Likert scale (1=very dissatisfied, 5=satisfied).
The fifth section asked about the current condition of the bathroom environment with questions about bathroom fixtures, replacement and remodelling plans, and the budget. The sixth section assessed comfort in performing ADLs in the bathroom. The seventh section assessed bathroom environment with a five-point Likert scale (1=extremely unnecessary. 5=extremely necessary) with questions about senior-friendly and accessible features.
The next section started with an open ended question that asked if participants wanted to change the layout of the kitchen in relation to dining and living room areas. It also asked about the current kitchen layout design and any desire to change it in the future. A diagram of each layout design example was presented to communicate more clearly. Questions about kitchen equipment and the dining table size were included as well. The ninth section assessed comfort in performing ADLs in the kitchen with a five-point Likert scale (1=very uncomfortable, 5=very comfortable). The tenth section assessed kitchen environment with a five-point Likert scale (1=extremely unnecessary. 5=extremely necessary) with questions about senior-friendly and accessible features.
The survey ended with the last question asking if the participant thought it was valuable to do home remodels or improvements specifically for improving their abilities to age in their home.
4. Data analysis
The filled survey tool was coded in an Excel file and analyzed through descriptive statistics of each item. In addition to quantitative data analysis, each recording was transcribed in order to analyze qualitatively. Some comments that participants made for some questions and answers to open-ended questions offered valuable insights and were analyzed qualitatively
IV. Results
1. Socio-demographic analysis
The participants in this study included nine men and 22 women ranging in age from 61 to 94 years, and the average age was 76 years. There were 10 (32.26%) participants who lived alone; 17 (54.84%) lived with a spouse; two (6.45%) with child (ren); two (6.45%) with others. For monthly income, 15 (48.39%) participants earned more than $ 5,000. Nine (29.03%) participants earned between $2,001 and $5,000. Answers to the sources of income showed that participants were mainly self-supported as only 19% of them were receiving government subsidies, and the other 19% had other sources of income.
2. Senior friendly products needs
There were 35 senior-friendly products that were presented in color images to participants in order to determine which senior-friendly products they owned currently. Results showed that participants owned bathroom grab bars (N=15, 48.39%) the most, followed by comfort-height toilets (N=14, 45.16%), non-slip bath mats (N=12, 38.71%), and non-slip socks (N=12, 38.71%). There were nine items that none of the participants owned such as an adjustable bed with pedals, a portable bathtub, a portable toilet, etc. <Table 1>. So, most elderly people require bathing-related support products, and need products that support movements that are related to going out and walking, and those that sit and stand up.
Table 1.
Senior-Friendly Products: Owned and Desire to Own
3. Caregiver type
Among 31 participants, only six participants received other people’s help; professional caregivers (N=2), children (N=1), grandchildren (N=2), and others (N=1). They reported that they mainly had support for physical activities. For future preferences in terms of caregiver type, the majority (N=17, 54.84%) answered that they preferred a professional caregiver to children or other family members or friends.
4. Current housing: Status and satisfaction
Most participants lived in their own homes (N=28, 90.32%) and in a detached dwelling unit (N=27, 87.09%). The average house size was 1,964.16 sq.ft. The majority of their houses had one (58.06%, N=18) or two floors (19.35%, N=6), three bedrooms (58.16%, N=18), and two bathrooms (51.61%, N=16). The number of year participants spent in their current homes ranged from one to 48 years with an average of 18.3 years. Participants were asked about their satisfaction with general home conditions focusing on the accessibility issues and general HVAC conditions <Table 2>. Participants reported that they were mostly satisfied with current home conditions. The average satisfaction was over four out of five in most items. An interesting thing to note is that the home features that participants reported dissatisfaction with pointed to accessible height issues in the kitchen. Kitchen items included easiness-to-reach appliances and counter heights.
Table 2.
Satisfaction with Home Environment
5. Perception with bathroom
To understand physical environmental issues in the kitchen and bathroom, more specific questions were asked about these areas. For the bathroom, participants were asked to report all plumbing fixtures they had in bathrooms. The shower stall was the most popular shower/bath unit type (N=19), followed by the shower/tub combo (N=10) and bathtub (N=2). There were about one third of the participants, 38.71% (N=12) who had bathroom remodelling plans in the near future. For their remodelling budget, 35.48% (N=11) of them were willing to pay for a remodeling fee. Among them, 12.9% (N=4) were willing to pay $5,000-$10,000, and 9.68% (N=3) would pay $1,000-$5,000. Two people were willing to pay more than $10,000 and two were willing to spend less than $1,000.
Recordings of the structured interview with the survey were transcribed, and some of the comments offered great insights for researchers. As the quantitative analysis above revealed older adults who participated in this study preferred a shower to a bathtub. Many of them said that they did not take baths. One person said that he got rid of the bath when they did a bathroom remodeling.
P7: We just wanted a shower, we didn’t want a bath tub in this.
P11: check shower stall. There is a bathtub but I don’t take baths.
P12: ··· I use the tub because the shower’s in it but I don’t take baths very often so ···
P: that tub was a tub shower combination and we almost never used as a tub so that was a good reason to get rid of it and put in that shower stall, ···
To evaluate participants’ perception with bathroom environment in relation to their ADLs, the degrees of comfort with ADLs in bathroom and perception with its size were asked using with a five-point Likert scale <Table 3>. Results showed that participants felt mostly comfortable performing activities in the bathroom such as using the sink and toilet or washing hair and organizing stuff in the bathroom. A notable point from the result is that while participants reported four or more for most of the activities in terms of the level of comfort they felt, the average comfort level was 1.58 for ‘taking a bath’.
Table 3.
ADLs in Bathroom
| Activities in Bathroom | Comfort* | Net agreement (%) |
|---|---|---|
| Dressing/Undressing | 3.80 | 74.19 |
| Using sink | 4.67 | 96.77 |
| Using toilet | 4.61 | 90.32 |
| Showering | 4.32 | 87.10 |
| Taking a bath | 1.58 | 32.26 |
| Washing hair | 4.47 | 96.77 |
| Adequate space size for activities | 4.41 | 83.87 |
| Organizing materials | 4.16 | 74.19 |
| Cleaning | 3.51 | 54.84 |
Results from perceptions with bathroom features revealed that participants did not perceive accessible bathroom features as necessary items <Table 4>. Less than half of the participants answered that they would need most of accessible items listed. Previous studies (Brent et al., 1991; Fielo & Warren, 2001) suggested these items as necessary features in the bathroom. However, participants in this study did not perceive the importance of these features.
Table 4.
Perception with Bathroom Features
| Bathroom features | Perception* | Net agreement (%) |
|---|---|---|
| Sink | 12.90 | |
| Adjustable height sink | 2.00 | 6.45 |
| Handrails around sink | 2.00 | |
| Toilet | ||
| Bidet | 2.00 | 06.45 |
| Toilet safety rail | 2.83 | 29.03 |
| Raised toilet seat | 3.35 | 51.61 |
| Shower | ||
| Shower chair | 3.12 | 41.94 |
| Shower stall with bench | 3.16 | 41.94 |
| Bathtub | ||
| Bathtub seat | 2.35 | 22.58 |
| Bathtub lift | 1.80 | 3.23 |
| Bathtub grab bars | 3.32 | 41.94 |
| Walk-in tub | 2.09 | 19.35 |
The only feature that more than half of the participants agreed that they needed was a raised toilet seat. The transcribed comments highlighted participants’ perceptions with the raised toilet seat.
P1: I like the high toilets, those are fun.
P2: ··· we might do better having a higher one. Might do better. In the future we might need a higher one.
P4: ··· I borrowed equipment when I had my hip replaced. We had a raised toilet seat.
Other comments included needs for other features not included as examples in the survey tool. The heated floor in the bathroom was one of them.
P7: Our last home, the whole bathroom had an under-floor heat system so we didn’t have a heat system like this house has. So he put an electric mat under the floor
P12: ··· we have to have a space heater. This time of year, we have a space heater we turn on a few minutes ahead of time before we go in a shower. It's just okay.
6. Perception with kitchen environment
Forty five percent (N=14) of participants answered that they had a U-shaped kitchen layout; 16% (N=5) G-shape; 16% (N=5) L-shape; and 13% (N=4) Gallery <Table 5>. The result revealed a very interesting point about kitchen layout preferences among older adults; most participants wished to have a linear layout. The linear layout is the simplest layout of all types and takes up the smallest space <Table 5>.
Table 5.
The Kitchen Type
| Type | Current Kitchen layout | Layout they wish ty had | |||
|---|---|---|---|---|---|
| Current (N) | Current (%) | Wish (N) | Wish (%) | ||
| Linear | 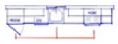 | 0 | 0% | 23 | 74.19% |
| Gallery | 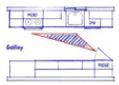 | 4 | 12.90% | 1 | 3.23% |
| L-shape | 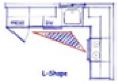 | 5 | 16.13% | 0 | 0% |
| U-shape | 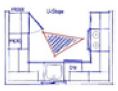 | 14 | 45.16% | 0 | 0% |
| G-shape | 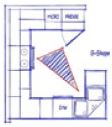 | 5 | 16.13% | 0 | 0% |
| Island | 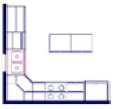 | 3 | 9.68% | 4 | 12.9% |
Results showed that participants felt mostly comfortable performing activities in the kitchen such as preparing food, cooking and dishwashing in the kitchen as the net agreements were more than 70 % for all ADLs in the kitchen <Table 7>. ADLs such as ‘taking out the garbage’ and ‘recycling’ showed somewhat low perception of comfort compared to other activities.
Table 6.
The Kitchen Equipments
Table 7.
ADLs in Kitchen
| ADLs | Comfort* | Net agreement (%) |
|---|---|---|
| Preparing food | 4.52 | 90.32 |
| Cooking | 4.52 | 90.32 |
| Table setting | 4.35 | 80.65 |
| Dining | 4.32 | 83.87 |
| Dishwashing | 4.48 | 90.32 |
| Cleaning | 4.42 | 87.10 |
| Take out the garbage | 4.19 | 74.19 |
| Recycling | 4.00 | 70.90 |
Most of accessible kitchen features were perceived as unnecessary things in participants’ kitchens <Table 8>. Accessible shelving was perceived as a necessary feature by more than half of the participants (64.52 %). This result was consistent with previous studies’ findings (Brent et al., 1991; Fielo & Warren, 2001).
Table 8.
Assessment of Kitchen Environment
| Features in Bathroom Issues related to bathroom use | Perception* | Net agreement (%) |
|---|---|---|
| Adjustable height sink | 2.26 | 12.90 |
| Accessible shelving | 3.77 | 64.52 |
| Induction range | 2.00 | 3.23 |
| Double door refrigerator | 2.87 | 35.48 |
| Front-load clothes washer | 2.23 | 19.35 |
| Touchless kitchen faucet | 2.03 | 9.68 |
| Dishwasher drawers | 2.32 | 12.90 |
| Adaptive tableware | 2.10 | 9.68 |
| Table for wheelchair | 2.29 | 16.13 |
Results about dining table sizes showed that all participants owned dining tables with four or more seats. Among them, 29.03% (N=9) had tables with eight seats and 45.16% (N=14) had tables with more than eight seats. Comments from the interviews showed participants desired to have bigger dining tables for socializing occasions even when a participant lived alone. This finding supports a previous study that socializing and conversation space is needed in older adults’ housing (Kang, Lyon, & Kramp, 2012).
V. Conclusion
The purpose of this study was to explore older adults’ perceptions with residential environment, satisfaction with physical environments, and perceived needs for elderly friendly products. In addition, this study examined perceptions with kitchen and bathroom environments and difficulties performing daily activities in these spaces. The following conclusions were drawn based on the results. The majority of participants were self-supported financially and living with other people (one or more). They preferred professional help for care rather than from family members or friends. Although they desired to live independently rather than relying on other people, they had very limited awareness or knowledge about commercially available elderly-friendly products that may contribute to independent living.
Their awareness of available home environment improvements was very low overall. This result aligns with previous studies. More attention to finding ways to introduce the benefits of environment-friendly products to older adults will be necessary to promote independent living and AIP.
Some design implications were developed to aid elderlyhousing designers and developers. For example, as older adults expressed that they do not often cook, smaller countertops and food storage spaces were found to be more desirable. On the other hand, a desire for larger social and entertaining areas among these older adults reflected that larger tables and seating spaces were ideal. Although events for gathering did not occur frequently within the home, older adults emphasized the value of such events with other people as both highly enjoyable and memorable. While older adults did not complain often about their physical environments, accessible shelving in the kitchen and Bathing was assessed as the most difficult activity for older adults.
To assist older adults, accessible products and social services to support bathing should be common priorities for elderlyhousing designers and developers. For assistive products, participants showed great interests with raised toilet seats. The raised toilet seat addresses sitting down and getting up from lower height toilet seats-an activity considered one of the most difficult by older adults.
Considering that the bathroom is the area where falls happen most often in the home environment, it is important to pay attention to it. AS this study has limitations such as low number of participants, future studies develop questionnaire that focus on the issues above and gather more data for statistical analysis to generalize the information discussed here.
